传说中的Nginx吞吐量性能到底如何,小弟这里献丑测试一番。
一、测试准备
1 硬件
1)DELL 2U 服务器 被测对象
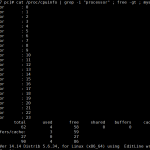
CPU : Intel(R) Xeon(R) CPU X5650 @ 2.67GHz 12核24线程
MEM : 64G
2) 自用PC机 压力机
CPU : Intel(R) Xeon(R) CPU E3-1230 V2 @ 3.30GHz 4核8线程
MEM : 16G
2 软件
1) DELL 2U 服务器 被测对象
IP:172.17.1.170
web server : openresty
2) 自用PC机 压力机
压力测试工具:ab
3 一些设定
1) 两台机器都关闭iptables防火墙
service iptables stop
2) 两台机器的文件打开数设定为65535
su root
ulimit -n 65535
3) 自用pc以init 3模式启动,减少图形界面带来的性能损耗
sed -i -e 's/id:5/id:3/g' /etc/inittab
init 6
二、测试过程
在自用PC上运行命令三次:
ab -n 200000 -c 1000 -k http://172.17.1.170/
三、测试结果分析
三次测试的结果如下,
This is ApacheBench, Version 2.3 <$Revision: 655654 $>
Copyright 1996 Adam Twiss, Zeus Technology Ltd, http://www.zeustech.net/
Licensed to The Apache Software Foundation, http://www.apache.org/
Benchmarking 172.17.1.170 (be patient)
Server Software: openresty/1.9.7.5
Server Hostname: 172.17.1.170
Server Port: 80
Document Path: /
Document Length: 178 bytes
Concurrency Level: 1000
Time taken for tests: 7.408 seconds
Complete requests: 200000
Failed requests: 393
(Connect: 0, Receive: 0, Length: 393, Exceptions: 0)
Write errors: 0
Non-2xx responses: 200000
Keep-Alive requests: 197660
Total transferred: 68000090 bytes
HTML transferred: 35607860 bytes
Requests per second: 26998.35 [#/sec] (mean)
Time per request: 37.039 [ms] (mean)
Time per request: 0.037 [ms] (mean, across all concurrent requests)
Transfer rate: 8964.31 [Kbytes/sec] received
Connection Times (ms)
min mean[+/-sd] median max
Connect: 0 2 64.0 0 3001
Processing: 2 11 68.3 4 3705
Waiting: 0 11 68.3 4 3705
Total: 2 13 110.1 4 6529
Percentage of the requests served within a certain time (ms)
50% 4
66% 4
75% 5
80% 9
90% 16
95% 17
98% 18
99% 45
100% 6529 (longest request)
This is ApacheBench, Version 2.3 <$Revision: 655654 $>
Copyright 1996 Adam Twiss, Zeus Technology Ltd, http://www.zeustech.net/
Licensed to The Apache Software Foundation, http://www.apache.org/
Benchmarking 172.17.1.170 (be patient)
Server Software: openresty/1.9.7.5
Server Hostname: 172.17.1.170
Server Port: 80
Document Path: /
Document Length: 178 bytes
Concurrency Level: 1000
Time taken for tests: 7.460 seconds
Complete requests: 200000
Failed requests: 805
(Connect: 0, Receive: 0, Length: 805, Exceptions: 0)
Write errors: 0
Non-2xx responses: 200000
Keep-Alive requests: 197253
Total transferred: 68010415 bytes
HTML transferred: 35616100 bytes
Requests per second: 26810.03 [#/sec] (mean)
Time per request: 37.299 [ms] (mean)
Time per request: 0.037 [ms] (mean, across all concurrent requests)
Transfer rate: 8903.13 [Kbytes/sec] received
Connection Times (ms)
min mean[+/-sd] median max
Connect: 0 2 55.3 0 3001
Processing: 0 9 59.5 4 3546
Waiting: 0 9 59.5 4 3546
Total: 0 10 97.8 4 6539
Percentage of the requests served within a certain time (ms)
50% 4
66% 4
75% 4
80% 4
90% 4
95% 5
98% 5
99% 59
100% 6539 (longest request)
This is ApacheBench, Version 2.3 <$Revision: 655654 $>
Copyright 1996 Adam Twiss, Zeus Technology Ltd, http://www.zeustech.net/
Licensed to The Apache Software Foundation, http://www.apache.org/
Benchmarking 172.17.1.170 (be patient)
Server Software: openresty/1.9.7.5
Server Hostname: 172.17.1.170
Server Port: 80
Document Path: /
Document Length: 178 bytes
Concurrency Level: 1000
Time taken for tests: 7.582 seconds
Complete requests: 200000
Failed requests: 105
(Connect: 0, Receive: 0, Length: 105, Exceptions: 0)
Write errors: 0
Non-2xx responses: 200015
Keep-Alive requests: 198002
Total transferred: 67998260 bytes
HTML transferred: 35604770 bytes
Requests per second: 26377.84 [#/sec] (mean)
Time per request: 37.911 [ms] (mean)
Time per request: 0.038 [ms] (mean, across all concurrent requests)
Transfer rate: 8758.04 [Kbytes/sec] received
Connection Times (ms)
min mean[+/-sd] median max
Connect: 0 2 59.1 0 7000
Processing: 3 12 70.7 4 6717
Waiting: 0 12 70.7 4 6717
Total: 3 13 104.5 4 7473
Percentage of the requests served within a certain time (ms)
50% 4
66% 4
75% 5
80% 11
90% 17
95% 17
98% 18
99% 192
100% 7473 (longest request)
This is ApacheBench, Version 2.3 <$Revision: 655654 $>
Copyright 1996 Adam Twiss, Zeus Technology Ltd, http://www.zeustech.net/
Licensed to The Apache Software Foundation, http://www.apache.org/
Benchmarking 172.17.1.170 (be patient)
Server Software: openresty/1.9.7.5
Server Hostname: 172.17.1.170
Server Port: 80
Document Path: /
Document Length: 178 bytes
Concurrency Level: 1000
Time taken for tests: 7.446 seconds
Complete requests: 200000
Failed requests: 551
(Connect: 0, Receive: 0, Length: 551, Exceptions: 0)
Write errors: 0
Non-2xx responses: 200009
Keep-Alive requests: 197505
Total transferred: 68007115 bytes
HTML transferred: 35612622 bytes
Requests per second: 26858.97 [#/sec] (mean)
Time per request: 37.232 [ms] (mean)
Time per request: 0.037 [ms] (mean, across all concurrent requests)
Transfer rate: 8918.95 [Kbytes/sec] received
Connection Times (ms)
min mean[+/-sd] median max
Connect: 0 1 53.2 0 3001
Processing: 2 10 60.0 4 3641
Waiting: 0 10 60.0 4 3641
Total: 2 11 94.1 4 6533
Percentage of the requests served within a certain time (ms)
50% 4
66% 4
75% 4
80% 4
90% 9
95% 10
98% 11
99% 47
100% 6533 (longest request)
三次的每秒处理的请求数都在26000以上,平均值为26728